


A box score looks like a neutral record, yet two fans can read the same one and walk away with opposite stories. One sees a 40-point win and calls the team perfect. The other notices eleven turnovers and a pile of missed free throws and wonders what happens against a better opponent. Neither is wrong, but only one of them is asking questions the numbers can answer. This guide shows how to read a college basketball box score in a structured way: start with possessions, adjust shooting for the value of a three, check the four factors, and only then look at the individual lines.
Start with the question, not the number
Before you read a single column, decide what you want to know. Was the result a fair picture of the game? Did one team simply shoot unusually well or badly? Is a particular player doing something repeatable? Each question points to a different part of the box score. A fair-picture question starts with team totals. A repeatability question starts with how the player scored: at the rim, from three, or at the line.
It also helps to separate what happened from why it happened. The score tells you what happened. The shooting splits, turnovers and rebounds point toward why. If you can write one sentence such as “Team A won because it shot better on threes and forced more turnovers,” you have a claim you can test against the rest of the page. If a claim does not survive the numbers, drop it and form another.
Possessions: the denominator everything needs
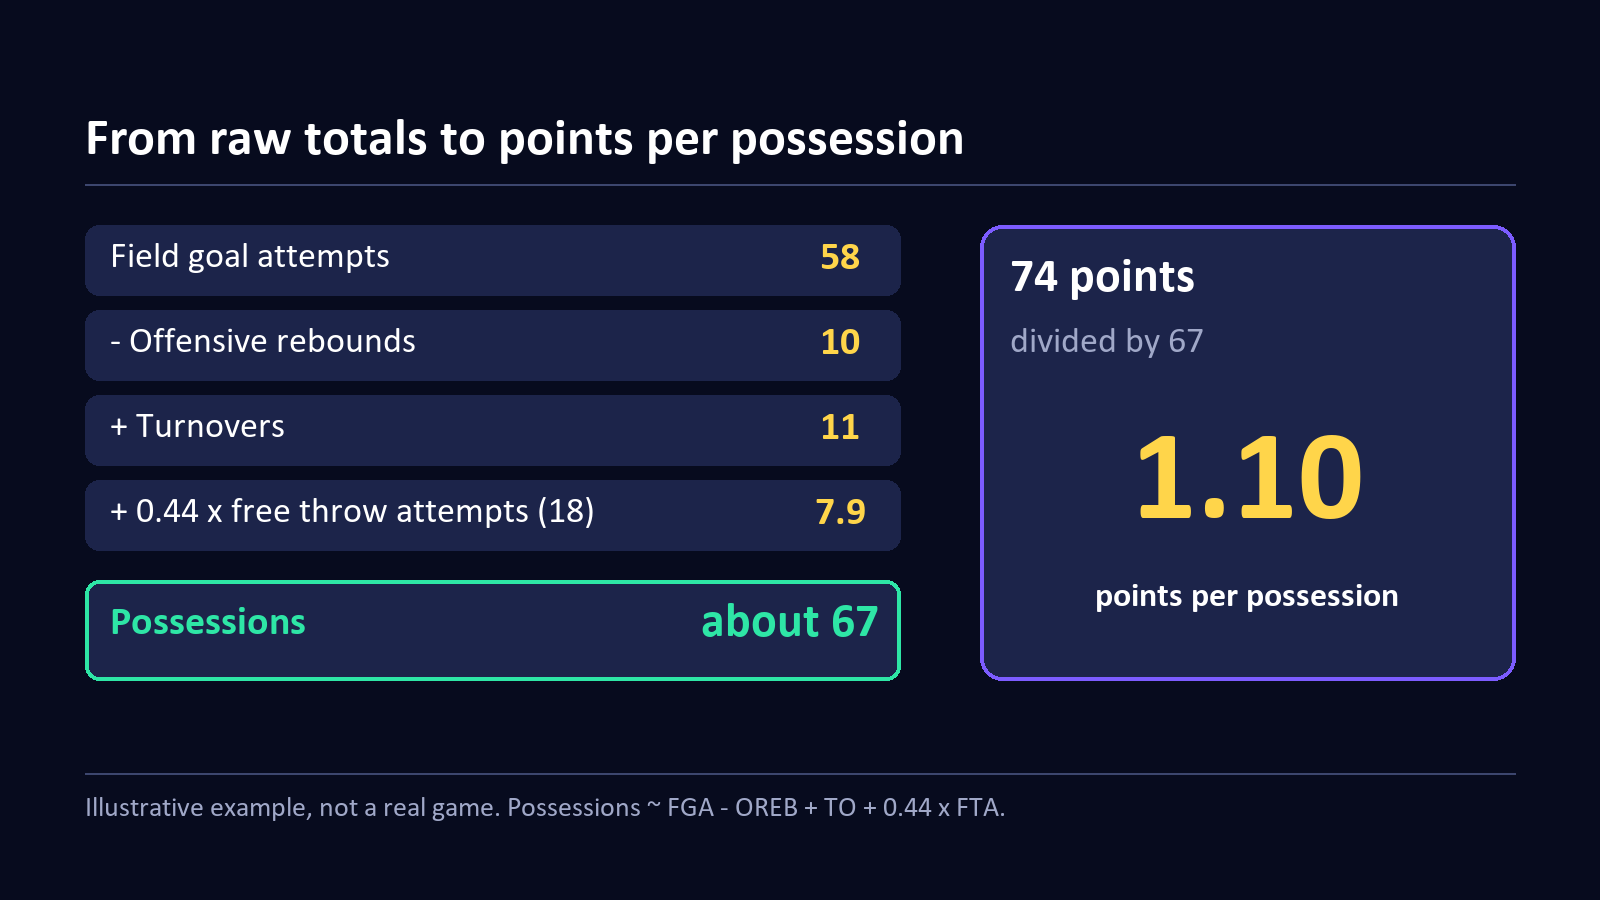
Raw totals mislead because teams play at different speeds. A team that scores 80 in a slow game may be more efficient than a team that scores 90 in a fast one. The fix is to count possessions. A simple and widely used estimate is: field goal attempts, minus offensive rebounds, plus turnovers, plus 0.44 times free throw attempts. The 0.44 is a rough allowance for the fact that not every free throw trip ends a possession.
Here is an illustrative example, not taken from a real game. Suppose a team attempts 58 field goals, grabs 10 offensive rebounds, commits 11 turnovers and shoots 18 free throws. The estimate is 58 – 10 + 11 + 7.9, which is about 67 possessions. If that team scores 74 points, it averaged roughly 1.10 points per possession. The opponent might score 70 on the same possessions, which is 1.04. Now the game has a clear margin in a unit that does not depend on pace.
Pace and efficiency are different ideas. Pace is how many possessions a team plays. Efficiency is how many points it gets from them. A team can be quick and poor, slow and excellent, or anything in between. When you read a box score, ask about both, and avoid treating a high total as a sign of a good offense. It can simply mean there were many possessions.
Effective field goal percentage: why a three is worth more than a two
Plain field goal percentage treats every made basket the same, which is clearly wrong. A made three is worth 50 percent more than a made two. Effective field goal percentage corrects for that: add half of the made threes to the made field goals, then divide by attempts. The formula is (FGM + 0.5 x 3PM) / FGA.
Take a clean real example from a recent exhibition. In its 103-64 win over Tennessee, Duke freshman Deron Rippey Jr. scored 21 points on 9-of-12 shooting, including 3-of-6 from three, according to the DukeBlog recap of the game. The arithmetic checks out without any free throws: six twos are 12 points and three threes are 9 more, for 21. His effective field goal percentage is (9 + 1.5) / 12, which is 87.5 percent. That is a spectacular night, and it is also a small sample. One exhibition against an opponent that is still finding its form is a good reason to be pleased, not a reason to project a season.
Notice what the percentage does not say. It does not say how difficult the shots were, how many came in transition, or whether defenders were in position. Shot quality needs film or tracking data. The box score gives you the outcome of the shots, and your job is to be honest about the limits of that.
The four factors: shooting, turnovers, rebounding, free throws
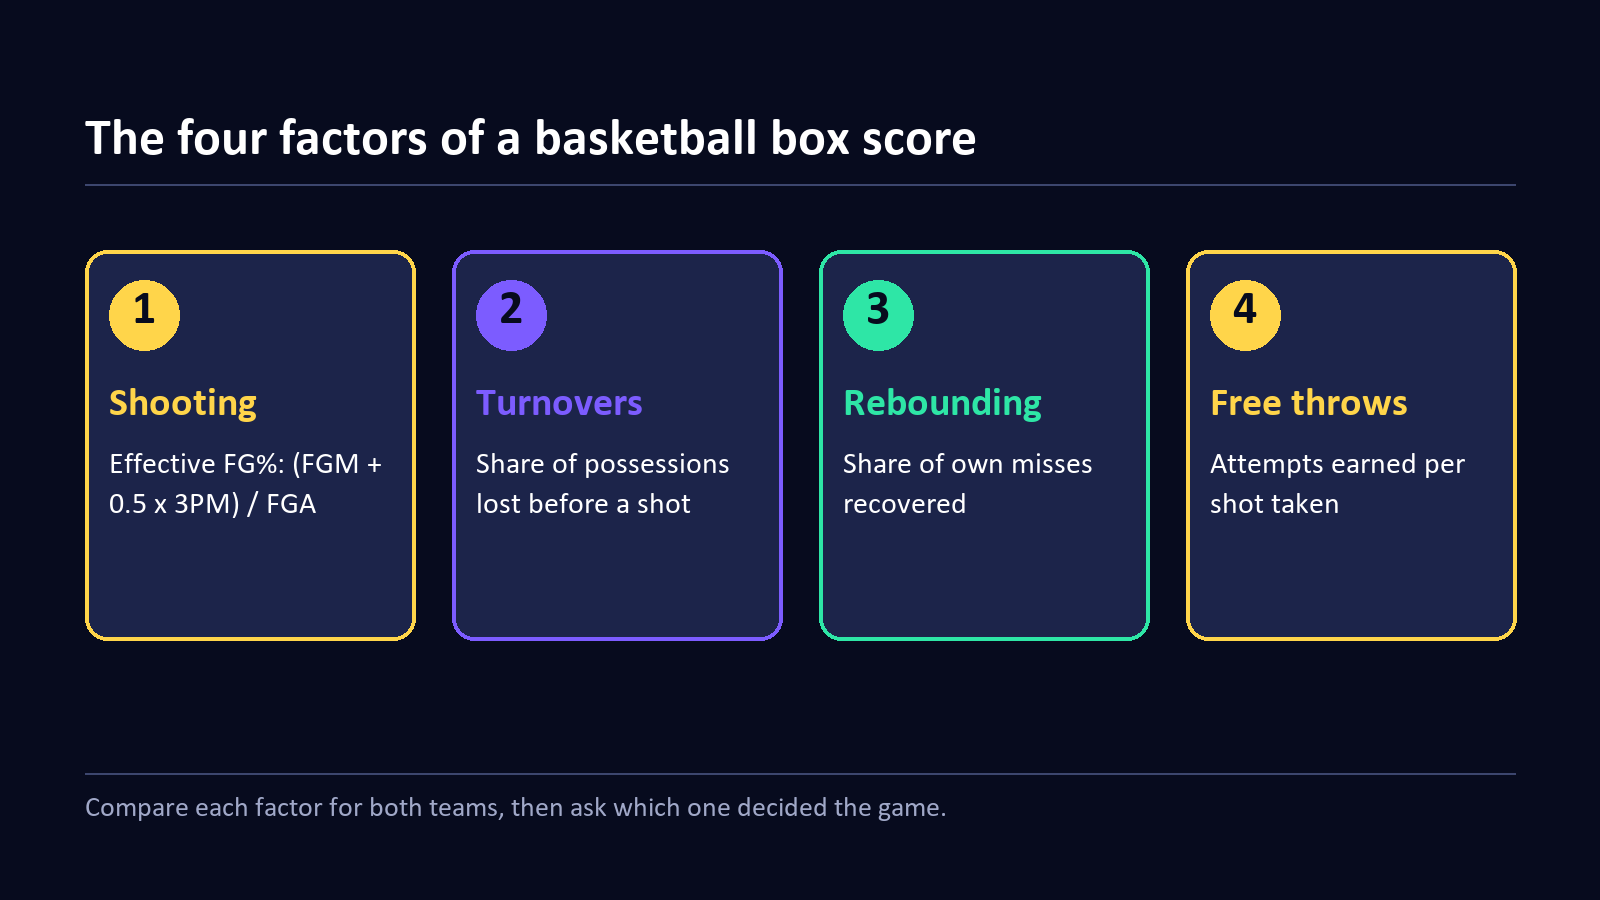
Basketball analysts often reduce a game to four factors. They are shooting efficiency (effective field goal percentage), turnover rate, offensive rebounding, and getting to the free throw line. Each team has an offensive and a defensive version, so one game gives you eight small comparisons.
- Shooting: who had the better effective field goal percentage? This usually carries the most weight.
- Turnovers: who gave the ball away on a smaller share of possessions? A turnover is a shot you did not get to take.
- Rebounding: who got more of the available misses on offense? A second chance extends a possession.
- Free throws: who earned more attempts relative to their field goal attempts, and who made them?
In the same Tennessee game, the recap describes a 29-9 run after an even 2-2 start, a defense that produced 10 steals, and 7 blocked shots. Steals are a direct link to the turnover factor. Ten steals do not tell you the full turnover count, but they hint that Duke ended many possessions before a shot was taken. When one team wins several factors by a wide margin, the result is rarely a fluke, even if the exhibition setting makes the margin exaggerated.
Individual lines: volume, efficiency and minutes
When you move from the team to a player, look at three things together: how much the player did, how efficiently, and for how long. Points per game alone rewards players who shoot a lot. Pair it with shooting percentage, free throw attempts and minutes.
The DukeBlog profile of Patrick Ngongba gives a good example. It lists his previous season as 10.1 points, 5.8 rebounds, 2.0 assists and 1.1 blocks per game on 60.6 percent shooting. A high field goal percentage for a big man is common, because many of the attempts come close to the basket. So the useful follow-up question is not whether 60.6 percent is high, but how much of the offense he can create and how many minutes he stays on the floor without foul trouble. Those are the same concerns that appear in the site’s five questions about the coming season, where availability and foul trouble matter as much as talent.
Per-minute numbers help when playing time differs. If a reserve scores 8 points in 12 minutes, his rate is 0.67 points a minute, or about 27 points per 40 minutes. That does not mean he would score 27 in a starter’s role. Rates tend to fall when the opposition’s best defenders play more against you, and tired legs shoot worse. Treat per-40 figures as a way to compare, not a promise.
Common mistakes and small-sample warnings
The most frequent error is reading too much into a handful of games. College basketball seasons are short, and early results are often against uneven competition. A shooting percentage from three can swing wildly over ten attempts. A useful habit is to ask how much the number would move if one more shot had gone in or out.
A second mistake is confusing a blowout with proof of quality. A large margin can come from a hot shooting night that will not repeat, and a narrow loss can hide a team that created far better looks. For the same reason, an outcome-based record is only half of the picture. Our guide on why sport results are so hard to predict explains how analysts deal with luck, and the same thinking applies on the court.
A third mistake is ignoring context that never appears in the totals: injuries, rotations, travel, and whether the game mattered. The Duke exhibition was played without two probable starters, according to the recap, which is exactly the type of detail that a box score cannot show. Read the numbers, then read the notes.
A one-minute checklist for any box score
- Estimate possessions and check whether the pace was fast or slow.
- Compare effective field goal percentage for both teams.
- Compare turnovers and offensive rebounds.
- Check free throw attempts, not just the percentage made.
- Pick the two players who changed the game and look at their minutes and shooting splits.
- Write one sentence explaining the result, then look for the number that contradicts it.
- Remind yourself how small the sample is.
If you want to practise, open any recent game and run the checklist before you read the recap. Afterwards compare your sentence to the writer’s. You will often agree on the headline and disagree on the reason, and that gap is where the learning happens. For live scores, schedules and our own game pages, see the Scoredium basketball page, and if you enjoy testing your own calls, take a look at the Scoredium leaderboard.
Frequently asked questions
Do I need to calculate possessions by hand every time?
No. The formula is helpful for understanding, but many stats sites publish pace and efficiency already. Doing it by hand once or twice teaches you what those published numbers represent.
Is effective field goal percentage better than true shooting percentage?
They answer slightly different questions. Effective field goal percentage values threes properly. True shooting percentage also includes free throws, so it is a better single number for overall scoring efficiency, while the former is easier to compute from a quick glance.
How many games do I need before trusting a player’s shooting numbers?
There is no magic number, but threes need far more attempts than twos before they settle. As a rule of thumb, treat anything under a few hundred attempts with caution, and look at free throw percentage as a hint about shooting touch.
Why do blowouts sometimes distort the box score?
Once a game is decided, coaches empty the bench and the pace and shot selection change. Numbers from garbage time can make a team look better or worse than it was while the game was still open.